import matplotlib.pyplot as plt
import seaborn as sns
import numpy as np
import pandas as pd15 Data Visualisation with matplotlib and seaborn
Learning Objectives
- Be able to visualise biological data using Python
- Create a plots using ‘matplotlib’ and ‘seaborn’
- Customize the plots with titles, labels, and legends
15.1 Using matplotlib and seaborn
matplotlib is a widely used plotting library in Python, providing a wide range of capabilities
seaborn is built on top of matplotlib and offers a high-level interface. It simplifies the process of creating plots and enhances their aesthetics.
Import Required Libraries
!pip install seaborn
Example Dataset
For the example:
np.random.seed(42)
data = {
       'height': np.random.normal(160, 10, 100),  # Normal distribution (mean=160, std=10)
       'weight': np.random.normal(65, 15, 100)    # Normal distribution (mean=65, std=15)
       }

df = pd.DataFrame(data)
Scatter Plot
Create a scatter plot to visualize the relationship between height and weight.
plt.figure(figsize=(8, 5))
plt.scatter(df['height'], df['weight'], color='blue', alpha=0.6)
plt.title('Scatter Plot of Height vs. Weight')
plt.xlabel('Height (cm)')
plt.ylabel('Weight (kg)')
plt.grid()
plt.show()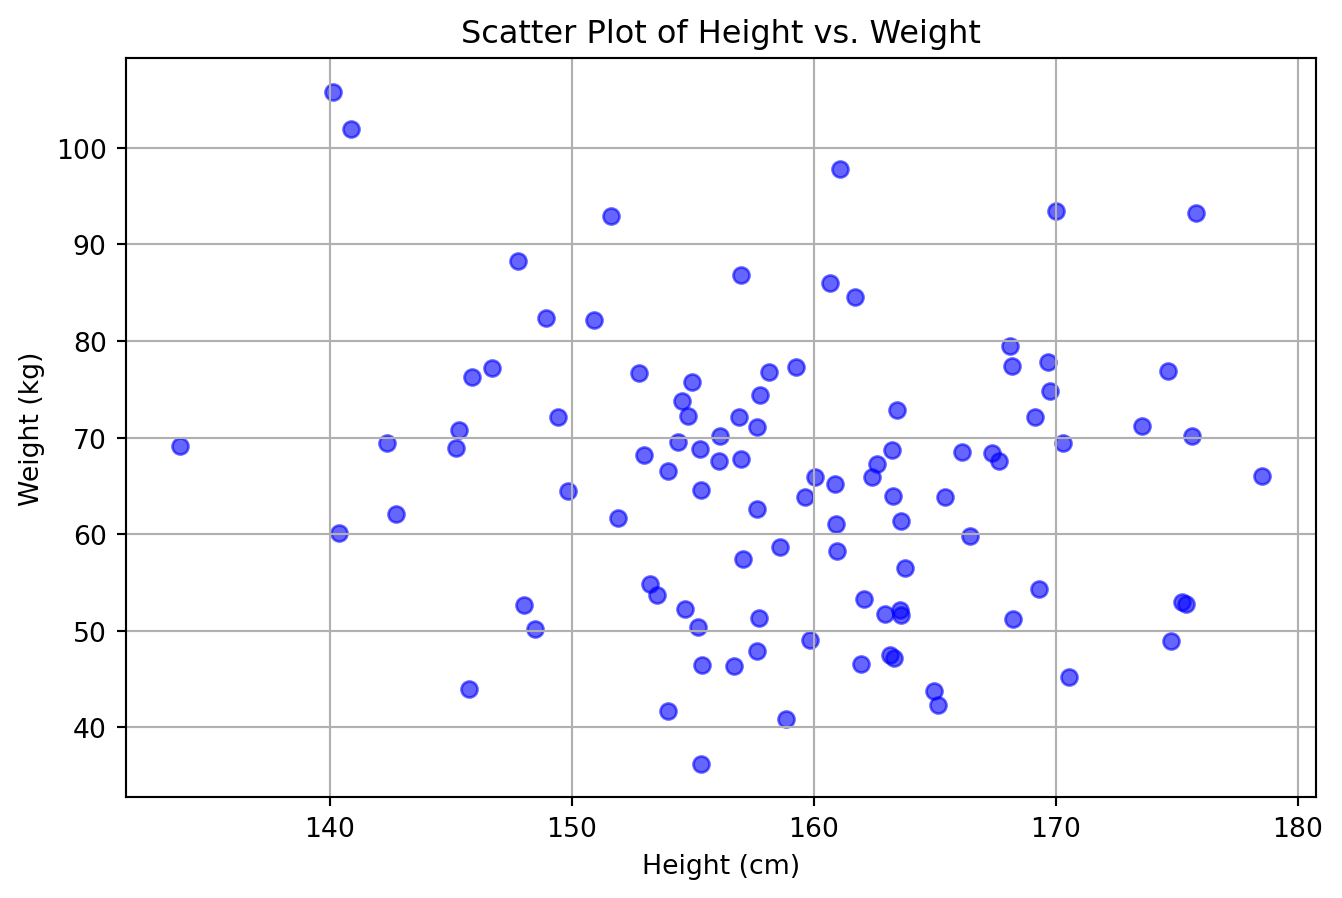
Histogram
Create a histogram to show the distribution of weights.
plt.figure(figsize=(8, 5))
plt.hist(df['weight'], bins=15, color='green', edgecolor='black', alpha=0.7)
plt.title('Histogram of Weights')
plt.xlabel('Weight (kg)')
plt.ylabel('Frequency')
plt.grid()
plt.show()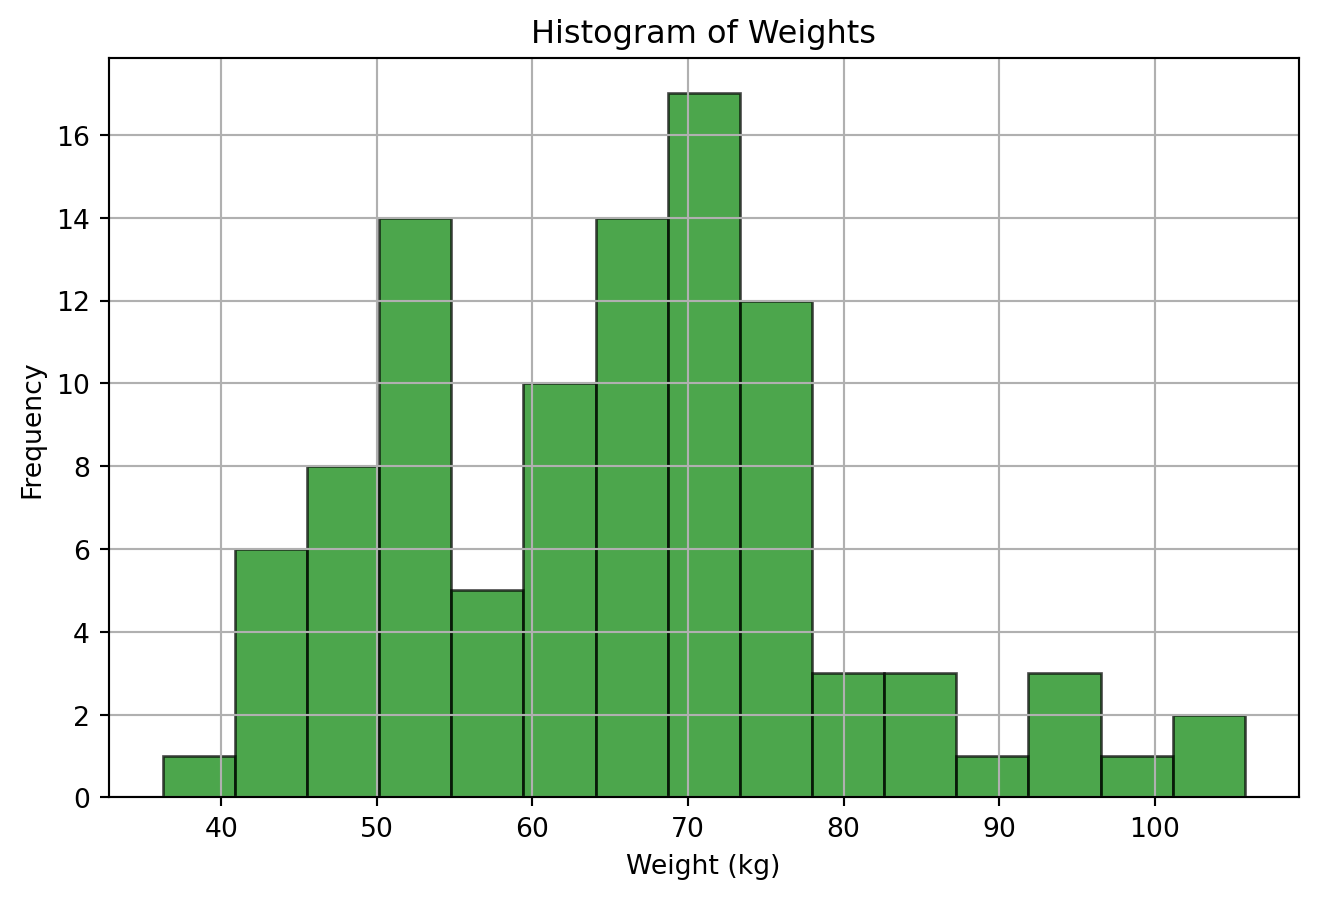
Boxplot with Seaborn
Use Seaborn to create a boxplot to visualize the distribution of heights.
plt.figure(figsize=(8, 5))
sns.boxplot(y=df['height'], color='orange')
plt.title('Boxplot of Heights')
plt.ylabel('Height (cm)')
plt.grid()
plt.show()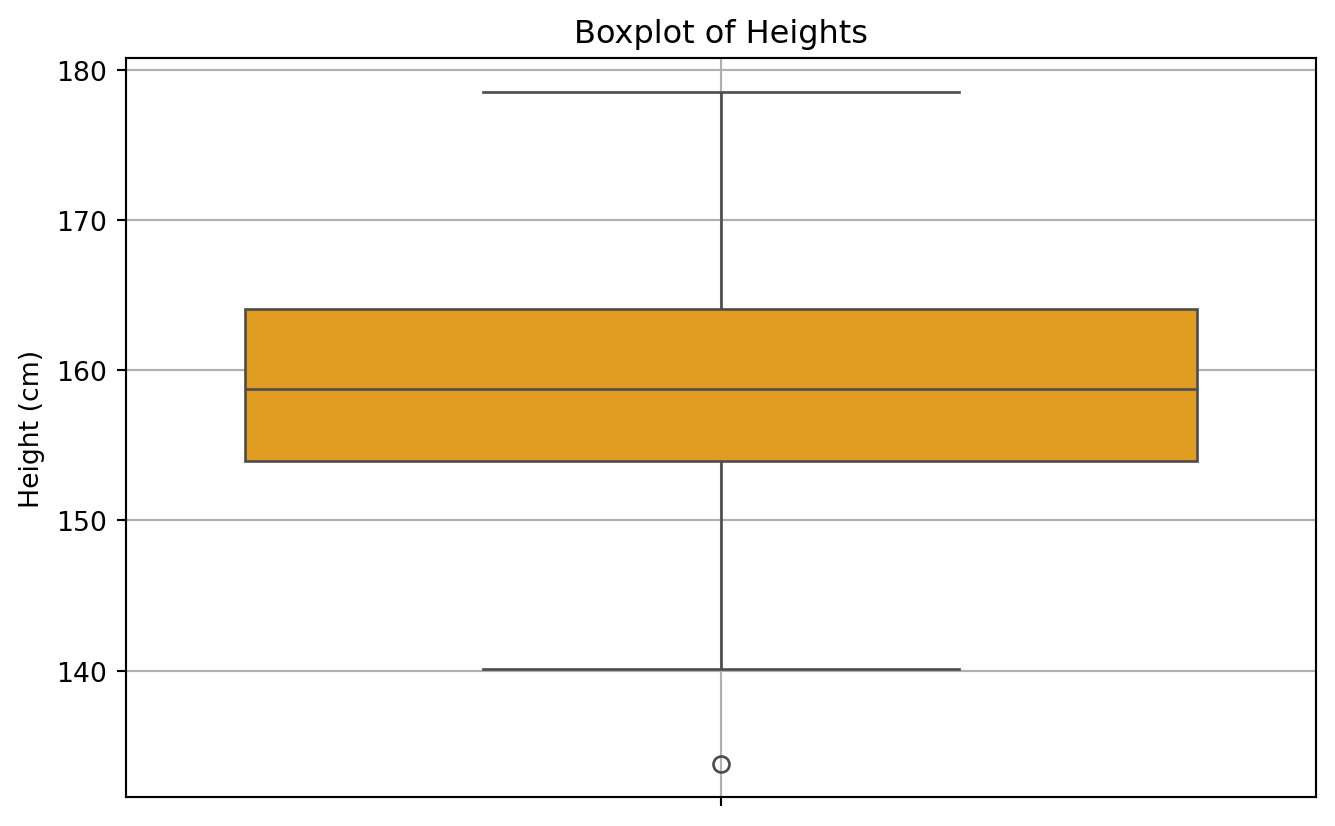
15.2 Documentation
See the documentation for ‘seaborn’ here:
https://seaborn.pydata.org/
Waskom, M. L., (2021). seaborn: statistical data visualization. Journal of Open Source Software, 6(60), 3021, https://doi.org/10.21105/joss.03021.
J. D. Hunter, “Matplotlib: A 2D Graphics Environment”, Computing in Science & Engineering, vol. 9, no. 3, pp. 90-95, 2007.
See the documentation for ‘matplotlib’ here:
https://matplotlib.org/stable/index.html
15.3 Summary
Now you have all the tools you need!
Tomorrow we will use all you have learnt so far
Key Points
- Plotting and visualisation is key to understanding and working with data
- ‘matplotlib’ and ‘seaborn’ can be used to plot your data in Python